Exploring the effect of motor traffic on street crime
Jose Pina-Sánchez & Toby Davies
Picture: Mike Malone
Introduction
A huge literature documenting how traffic harms quality of life
– accidents, pollution, noise, loss of exercise, social capital, …
An even bigger literature exploring predictors of street crime
– +5K studies identified in the Handbook of Crime Correlates
Yet, only a couple of studies have specifically looked into the effect of motor traffic on street crime
Picture: Mike Malone
Why?
Picture: Paul Farmer
Multiple small indirect effects?
- Actually, many different crime theories could be used to predict an effect of traffic on crime
Picture: Paul Farmer
Analytical strategy
Picture: Sandy B
Longitudinal data
Three waves from Understanding Society (2012, 2015 and 2018)
– necessary to observe changes in neighbourhoods across time
– remove those who moved to a different address
– lots of attrition (about 60% missing in 2015 and 90% in 2018)
– adjusted using multiple imputation
Subjective measures of motor traffic and perceptions of crime
– derived from the interviewer and the interviewee
– which eliminates methods effects
Picture: Sandy B
2-Way fixed effects models
We model the within-person change across time
– \((Y_{it} - \bar{Y}_i) = \beta_0 + \beta_1 (X_{1it} - \bar{X}_{1i}) + \sum_{t=2}^{7} \beta_k X_{kit} + \epsilon_{it}\)
– controlling for average change in perceptions of crime across time and for time of the day when the interview took place
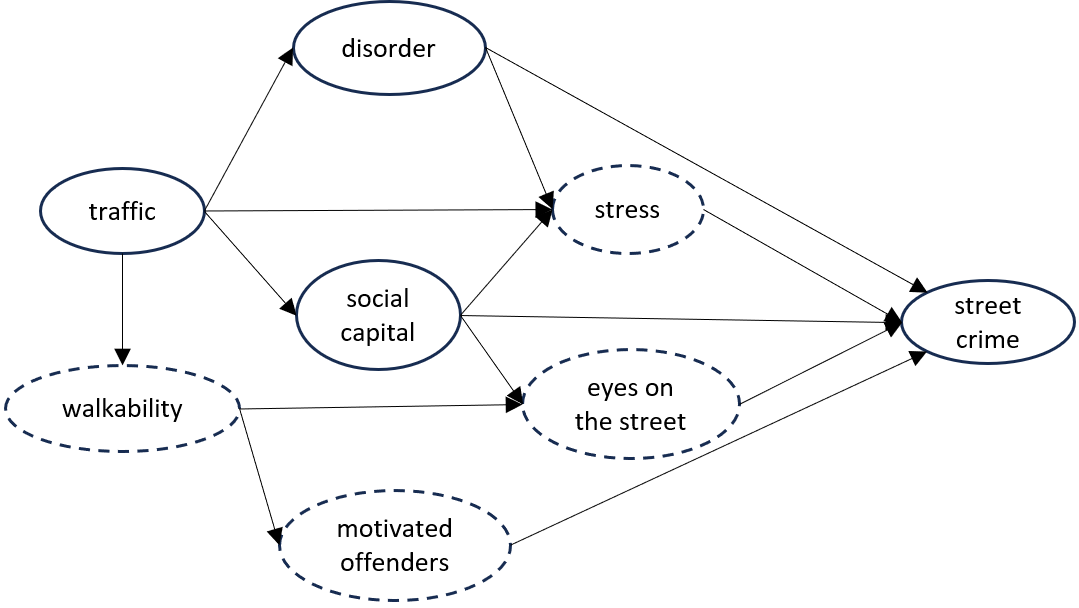
We focus on the total effect of traffic on crime
– and indirect effects through social capital and disorder
Picture: Sandy B
Findings
Picture: Jack Fifield
Total effects
When a neighbourhood goes from “non-heavy traffic” to “heavy traffic”…
– we estimate an 8.6%, 6.4% and 6.9% increase in perceptions of vandalism, theft, and violence
Picture: Jack Fifield
Mediating effects?
Traffic is +ly associated with perceptions of disorder (graffity, litter, and boarded houses)
And -ly associated with social capital (whether neighbours are perceived to help each other)
These in turn are +ly associated with perceptions of crime
Picture: Jack Fifield
Robustness Checks
Picture: Allen Watkin
Missing data not at random
High levels of attrition
– 60% in wave-2 and 90% in wave-3
Replicated our analysis just for the first two waves
– found very similar results
Picture: Allen Watkin
Confounding bias
We cannot anticipate an obvious time-changing confounder
– we cannot rule it out either
A “small” confounder could render our findings non-significant
– our robustness values range from 2.8% to 4%
Picture: Allen Watkin
Measurement error
Interviewee’s records of ‘heavy traffic’ are noisy
– can see this as classical measurement error
Attenuation bias (roughly) proportional to the errors
– e.g. a reliability of 0.8, attenuates our estimates by 1.2
Picture: Allen Watkin
Discussion
Picture: Colin Babb
Theoretical implications
Motor traffic appears to cause crime
– worth investigating the specific mechanisms behind that
– silly to keep proposing monocausal crime theories
Cars & Crime as a nascent subdiscipline
– Why don’t we use driving bans more often?
– Why is fear of cars not seen as a form of fear of crime?
– Why are collisions against pedestrians not part of crime prevention strategies?
Picture: Colin Babb
Policy implications
Reducing car dependency is even more beneficial than we thought
– beyond all its known benefits, it also seems to reduce crime
Crime prevention policy needs to recognise the criminogenic effect of motor traffic
– Secured by Design HOMES should be reconsidered
– e.g. culs-de-sac might be less prone to burglary but they force higher crime elsewhere by encouraging driving
Picture: Colin Babb
Let’s build cities where we don’t need cars
Picture: Colin Babb
![]()